


How do BDCs generate >10% dividend yield?
A toy model shows how ARCC is like a commercial bank without deposits. Skilled but costly managers leverage 5+% spreads up to ~16% ROE (≈ dividend yield), which drops to ~10% yield after compensation.

I allocated to several business development companies (BDCs) before I sufficiently understood them. Why? They helped me quickly reach a desired portfolio yield1. Now I’m belatedly taking a closer look at my BDCs in order to reallocate, and to crystalize my implicit view on the interest rate term structure2. The first thing I want to do is understand the BDC business model. Given my allocation motivation, the burning question is: are my 10+% yields sustainable, how exactly are they generated, and what is their risk profile?
To answer this question, I’ve replicated the 2024 financials for Ares Capital Corporation (ARCC). I selected ARCC because it is, by far, the largest BDC and it is a popular recommendation. I want to stress that I’ve replicated the financials with a toy model (my favorite kind!). Before I built this toy model, I consumed many analysts posts on BDCs, but ironically all of that reading that didn’t really arm me with a basic understanding of the business model3. The purpose of the toy model is to grasp the key value drivers of the business. This is an exercise in noise reduction: what can be ignored? Before I reallocate, I want to know what I should focus on, and importantly, I don’t want to focus on too many variables. My investing journey has trapped me down too many “deep dive” mineshafts, only to realize that (at least for myself), I do better when I isolate on the fewer variables that matter most.
A toy model that explains the business
Here is my super simple ARCC model. It reveals that a business development company (BDC) is basically a commercial bank without deposits. ARCC borrows at ~5% and lends at ~ 11% to generates an investment spread of ~ 6%. Somewhat conservative leverage (~ 1:1 debt-to-equity) effectively boosts that spread to >16%. But considerable management fees reduce that 16% ROE to an ROE of >10%. As a BDC, almost all of the income must be distributed such that an ROE of 10.10% translates into a dividend yield of 9.90%.
Below is a screenshot of the Google sheet with input assumptions in yellow. My numbers are rounded, but near enough to ARCC’s 2024 10K (as the source). The only difference between the columns is the Management Fees (Expense) Rate: the first column (3.0%) is nearer to ARCC’s actual expense; the second column is just an alternative scenario to illustrate the considerable impact of fees.
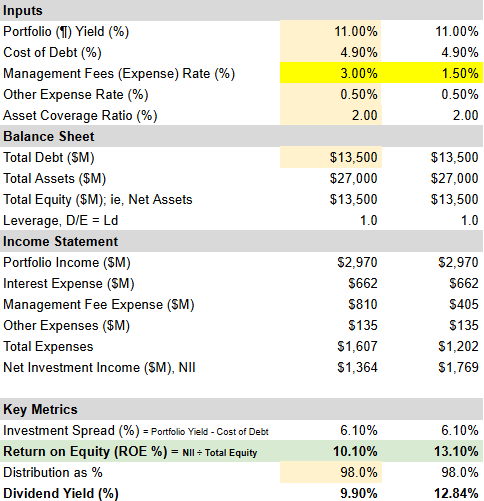
As you can see (above), $27.0 billion in assets that yield 11.0% generate almost $3.0 billion ($2.97 billion) in Portfolio Income. The total expense ($662 million interest + $810 million for management fees + $135 million other) is $1.607 billion such that the net investment income (NII) is $1.364 billion. My self-designed labels do not necessarily correspond to the more granular accounts in the 10K: it’s a toy model.
In this simplified way, Net Investment Income (NII) of $1.364 billion generates a return on equity (ROE) of 10.10% which is almost entirely distributed4 into a 9.80% dividend.
Here’s what really leaps out for me:
ARCC is a talented banker! Incredibly, they borrow at nearly the risk-free rate and lend those funds skillfully. Specifically:
In regard to funding, ARCC’s low cost of debt (< 5.0%) initially surprised me, but they employ conservative leverage, maintain ample liquidity and enjoy investment grade status by all three major rating agencies (~ BBB or Baa2).
In regard to lending, the 10K’s schedule Schedule of Investments is about 150 pages! The reference rate is SOFR (which replaced LIBOR) and my quick tabulation suggests a medium spread of 5.50% over SOFR with an IQR of 1.25%. Most are first or second lien senior secured loans, but ARCC also invests in subordinated debt and preferred equity.
In regard to credit quality, at year’s end, loans on non-accrual status were 1.7% of the total at cost (or 1.0% of fair value); in the last quarter, non-accrual status improved to 1.0% of cost (or 0.5% at fair value).
ARCC’s manager-lenders are well compensated for their skill. The management fee expense (aka, compensation expense) is a considerable drag on ROE. My 3.0% Management Fee Rate multiplies by Total Assets ($27 billion) to imply a compensation expense of $810 million, but the actual pay plan is way more sophisticated. In 2024, the compensation expense was ~$756 million (versus my toy model’s $810 million). Their compensation plan includes a Base Management Fee, an Income Based Fee, and a Capital Gains Incentive Fee.
Leverage creates real value for shareholders in this model. As I understand, regulations require an Asset Coverage Ratio of at least 1.50 (see row 6). But ARCC conservative targets a ratio of 1.90 to 2.25. If you reduce the Asset Coverage Ratio to 1.50 (in the first column), the implied Dividend Yield jumps from 9.90% to 12.45%.
Du Pont-style decompositions
Below the main panel of my toy model, I restated the ROE in various decompositions. The first (#1) is the DuPont-style that may be familiar to CFAs.
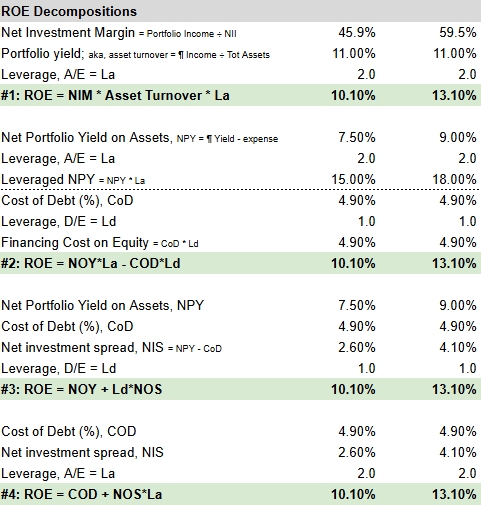
I think I’m most keen on the last decomposition (#4) because counterintuitively it starts with financing cost:
ROE = Cost of Debt + Net investment spread, NIS * Leverage, A/E
In this perspective, the cost of debt (i.e., 4.90%) is the return to ARCC’s lenders, but it’s also the baseline for shareholders. Shareholders earn a “risk premium” above this baseline, and that risk premium is compensation for the managers’ leveraged operational skill as measured by the portfolio’s spread net of its expenses.
Leads to questions
We can now ask:
The portfolio’s high yield: In regard to ARCC’s investment portfolio,
How is it diversified and what is the distribution of credit quality?
What percentage is first lien (vs second vs equity)?
What are the trends in non-accruals?
What are the durations (on asset and liability sides), and how much does duration matter to me?
The portfolio NAV: TBD
Cost of debt:
What is the maturity profile and interest rate sensitivity?
By owning ARCC, what implicit view am I expressing on the term structure dynamics?
Management fees: TBD
Leverage: TBD
Net investment income: TBD
I hope that’s helpful! If you’d like more coverage of BDCs, please do let me know.
In my income portfolio, the forward dividend yield of my BDC cluster is a value-weighted average of 12.16%. As such, the BDCs enable an overall income portfolio target dividend yield of ~ 7.0%.
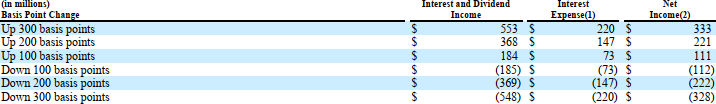
I’m interested in term structure shift and shape dynamics (eg., steepening), although the blunt conventional wisdom is that lower rates will hurt BDCs. I perceive that some investors underestimate the ALM sophistication of (eg) ARCC’s managers. Still, under Interest Rate Risk, ARCC’s 10K states “In a prolonged low interest rate environment, the difference between the total interest income earned on interest earning assets and the total interest expense incurred on interest bearing liabilities may be compressed, reducing our net income and potentially adversely affecting our operating results. Conversely, in a rising interest rate environment, such difference could potentially increase thereby increasing our net income as indicated per the table below. “
BDCs are a narrow segment but pretty well covered by a few experts, and skilled individual investors, on Seeking Alpha. Like REITs, the problem with this type of coverage is that each report tends to include a large matrix of metrics. And the medium encourages a constant stream of buy/hold/sell recommendations. It’s very hard to generate a decisive ranking based on a few metrics that reflect a smart focus. Let me put it another way. If I were to select BDC (or REIT) purchases based on Seeking Alpha coverage, it would largely (and ironically) be a function of which authors I happened to consume on any particular week. If you want to buy a security, you can always find a reason.
About the rules for distribution