


Stocks I own: DHI, LEN, TMHC (homebuilders)
They've grown to <25% of my portfolio (due to 25% CAGRs) and I really appreciated their simplicity. Although I'm unconcerned about interest rate dynamics, time to trim

My three homebuilders (DHI, TMHC and LEN) have grown to represent almost <25% of my public equities portfolio (below, lower left). Although their performance has been better than I expected when I began the thesis six years ago (when I bought my first LEN tranche in 5/2018), my bullish outlook has been validated.

At the time of that first purchase in 2018, I did weigh the drawbacks of homebuilders. Specifically, their negative factors were well-articulated by the talented Alex Pettee1 who I paraphrased: “His five good reasons to be bearish are: Homebuilding is a tough, low-margin business; Construction costs further squeeze margins; housing unaffordability; interest rate sensitive; and tax reform tips scales toward renting.”) but I was positively swayed in particular by Lennar (LEN)’s strong fundamentals and its cheap valuation. As I wrote at the time (LEN traded at $54.05 when this was published):
“Maybe the best bullish argument in favor of well-positioned single-family homebuilders is good old fashioned product supply and demand. Here, the timing looks favorable. The supply shortfall looks to persist for the foreseeable future … Maybe the best bullish argument in favor of well-positioned single-family homebuilders is good old fashioned product supply and demand. Here, the timing looks favorable. The supply shortfall looks to persist for the foreseeable future
… The valuation is appealing given its YTD drop. At today's price of $53.78, trailing P/E is about 14.0. Assuming the company's guidance for the second half of the year, the semi-forward P/E is 10.65. The analyst-based forward P/E appears to be only 7.8..” — Making A Down Payment On Lennar, David Harper
Below are 5-year total returns (as of yesterday) for the seven largest homebuilders. Per the heatmap above, I currently have positions in the two largest (LEN, DHI) and the sixth largest (TMHC). All three of my homebuilders trounced the SPDR S&P Homebuilder ETF (its 5-year gain is only +172% with similar, small yield); but I also did not capture Pulte’s (PHM) 324% or Toll Brother’s (TOL) 283% performance2.

Although I haven’t investigated why the homebuilder ETF hasn’t done better, my naïve self-evaluation is that my sector allocation was good, but my within-sector stock selection was better.
The appeal of public homebuilders is their quality, safety and simplicity. My sense is that Wall Street is positively re-rating (and likely to further re-rate) the homebuilders; e.g., in the last year, CFRA justified increasing DHI’s price target by +$26 by expanding their forward P/E by over two turns, from 11.0x to 12.2. This is why you can ignore the price targets published by most professional sell-side firms: they are lagging indicators that swing significantly according to ex post multiple compression/expansion narratives. Put more bluntly, most Wall Street price targets are a function of the currently trading price.
DHI is much bigger than TMHC is strong in upscale markets
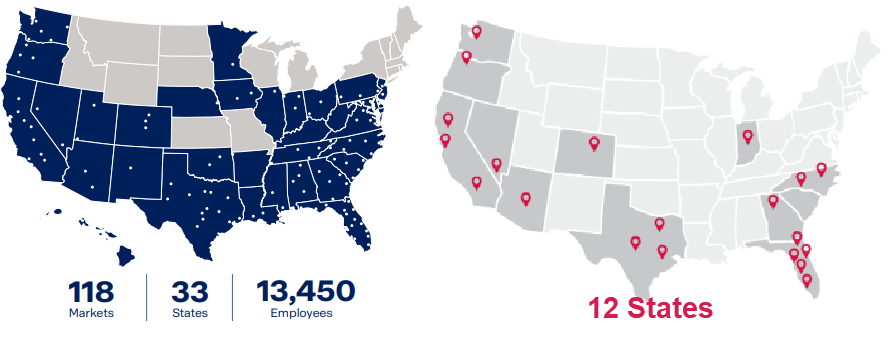
D.R. Horton (DHI) is a national builder (33 states, below left). Taylor Morrison (TMHC) has a smaller footprint focused in the West and South.
DHI has a broad product line but a lower average sales price (that has been flat) at $375,000. TMHC’s ASP is $600,000. This illustrates DHI’s advantage in offering affordable homes to first-time buyers, but it also illustrates TMCH’s advantage in the upscale market including “active adult” communities (aka, 55+ buyers). For further reference, my other homebuilder Lennar has seen its ASP drift down (from $500,000 at peak) to $425,000. The outlier is Toll Brothers with an ASP of ~$1.0 million.
DHI and TMHC have reported their 2024 Q3/Q2
I won’t overwhelm you (or myself) with a zoom into a detailed forest. It’s not necessary. An advantage of homebuilder stock is that they are simple businesses and not much has changed in five years. Judging by analyst queries on earnings calls, the market cares about their sales growth, gross margins, inventory, cash flow, geographic and demographic/segment positioning (e.g., first-time buyer, build-to-rent), construction cycle time, and importantly their capital allocation. Capital allocation especially matters because homebuilders are cyclical; in fact, it might be the most sophisticated viewpoint for an investor. However, precisely because the industry is cyclical, homebuilders cannot afford sticky dividends: it’s very hard to reduce the dividend. In general, homebuilders must rely on share repurchases. My forward yields ((not yields on my lower cost basis) are: LEN @ 1.17%, DHI @ 0.69%, TMCH @ 0%.
In regard to my three builders, these are low-growth companies with 23% +/- 2% gross margins who prudently allocate capital in a predictable business. Like LEN, they both have been gradually—since I’ve owned LEN—shifting toward a more “capital efficient land strategy”: controlling land (and lots) via option contracts primarily but also via joint ventures. Both cycle times and cancellations are stabilizing.
Between these two recent earnings reports, the items that interest me include:
DHI has an advantage in affordability. 50% of their buyers are first-time homebuyers. TMCH has an advantage in the “resort lifestyle” (aka, active adult) segment whose buyers are almost rate insensitive.
Both are now active in the rental market, in the case of TMHC via Yardly. Build-to-rent is a growth market, but it’s lumpy for the builders.
If you are considering an investment in either, I feel compelled to note that both suffer on the customer satisfaction scale. (Personally, this was my primary reluctance—my first homebuilder, LEN, fares better here than TMCH and much better than DHI. However, investing is a probabilistic estimation that sorts many known imperfections, while being meanwhile blithely ignorant of most information, into a choice, and the favorable valuations mattered more to me. The more I actually do it, the more I realize it is more art than science.).
According to management, nothing material has changed for either DHI or TMCH with respect to demand/supply fundamentals or interest rate outlook dynamics.
Interest rate dynamics are nontrivial
The interest rate factor fascinates me because so many commentators focus on a single-factor narrative. For example, one Seeking Alpha contributor repeatedly views high mortgage rates as a headwind for DHI (anchoring much of his overall recommendation on this factor) and the potential for rates cuts as a downside risk:
“At a high level, high interest rates drive up mortgage rates, which reduce existing home inventories as homeowners don’t want to refinance at a higher mortgage rate, and this drives demand for homes towards home builders.”
Well, yes. This is known as the lock-in effect: existing homeowners, ceteris paribus, do not want to sell out of a low rate and buy into a high rate. But if you read DHI’s earnings calls, you’ll see why management views the lock-in effect as a slight net positive to their business. More importantly, it’s only a single dynamic in a complicated multi-factor system (The businesses are simple, but the stocks exist in capital markets which are not simple). In totality, DHI management views the prospect of lower interest rates as a net tailwind3. Let me explicate on that next, if only for my own sake.
Interest rate dynamics are mixed but likely net positive (if rates decline)
The managements of both DHI and TMCH claim that lower interest rates will have a net positive effect. Specifically, what they say is this:
Positive: Lower rates lead to more affordable homes and more buyer traffic (even confidence and urgency, says Sheryl Palmer) which converts to more sales; aka, greater buyer demand due to improved affordability.
Positive: Reduced incentives (e.g., rate buy-downs) which improves gross profit margins.
Negative: Over the last year, both managements have referred to the above referenced lock-in effect, although rarely by that label. DHI and TMCH supply new construction which competes against the resale market. Lower rates should increase resale supply. Although new-versus-resale is not a commodity substitution. On the last (2024 Q2) call, TMHC’s CEO prepared remarks included here statement (emphasis mine), “Beyond the temporary volatility caused by interest rate movement and other headline noise, we remain confident that the need for new construction is firmly intact, supported by a multimillion deficit of housing units and involving demographic trends across multiple generations.
In the majority of our markets, affordable and desirable inventory options remain limited with months of supply still at manageable levels. And while resale inventory has started gravitating back toward historic norms, particularly in Florida and Texas, we are finding that much of the available product is generally not competitive to our amenity rich communities and quality design and newly constructed homes.”
What to do with this information
As I review the quarters of DHI and TMHC, these are questions I ask myself:
Is the thesis intact? Yes, these thesis is unchanged in six years. There is still a multimillion unit supply deficit.
From a valuation perspective, are DHI and TMCH rich/cheap/fair? Some analysts use price-to-book (P/B), but let’s keep things simple by looking at forward P/E. Among the seven largest homebuilders (graphed above), the median forward (GAAP) P/E is ~9.7x. Low valuation multiples are the norm4 for homebuilders; when I initiated my position in LEN, the forward P/E was only 7.8. Taylor Morrison’s (TMCH) forward P/E is only 7.6. DR Horton’s (DHI) is 11.9.
Do I have any special macro insight, especially in regard to interest rate (or recession concerns)? Not really. My only consideration here is that I believe the management teams when they repeatedly say that lower interest rates5 are a net positive.
What’s my portfolio perspective? First, I do want to reduce my overall allocation to homebuilders (25% is currently too much for me: it represents too much conservatism). My conservatism, in this case (as discussed above) does not even get me enviable yields. Second, I’ve learned that I own too many stocks. I want a shorter list of higher-conviction stocks (and I can index the balance). So I definitely will be doing some trimming.
Postscript:
After yesterday’s dramatic selloff, I was curious how my homebuilders reacted. I’m not a huge fan of betas, but the homebuilder industry has a 1-year beta of about 1.0. Below is a 5-day look. As you can see, LEN and DHI reacted along with the S&P 500. But TMHC doubled the loss (-9.63% versus -4.86%). And, indeed, TMHC has a high beta of 1.55. By my quick calcs (assuming riskfree rate of 5% per annum), the 1.55 beta implies an expected 5-day TMHC loss of -7.59%. Directionally, that’s close enough: the high beta does get reflected in an even worse drop (than the market’s)!

Alex Pettee is the President of HOYA Capital. His advisory manages two NYSE-listed real estate funds. His subscription service (Hoya Capital Income Builder) just merged with Brad Thomas’ iREIT service to become a new super service called iREIT®+HOYA Capital. It might be Seeking Alpha’s most popular service, or at least among the top five. I am a subscriber. I decided to subscribe because I want to be smart about rotating into dividend stocks/REITs.
Toll brothers (TOLL) is unique among the public homebuilders, as illustrated by its average home sales price of ~ $1.0 million. If you were (or are) focused on the affordability factor, TOLL would have been a contrarian bet; and it would have worked out great! Homebuilders are a relatively simple business, but to me, TOLL is a good example of the drawback of weighing a single factor too much. TOLL is a luxury builder serving the premium segment of buyers who can afford their homes.
Don’t get me wrong. I wouldn’t necessarily trust the transcript of an unfamiliar management team. But I’ve been lightly following these companies and their management teams for years.
Below is Perplexity’s response to my question, Why are homebuilder P/E ratios so much lower than other companies? I thought this was a brilliant response … until I realized that Perplexity basically scraped Alex’s article from 2020, Homebuilders: This Time Was Different
“Homebuilder P/E ratios are generally lower than those of other companies for several reasons:
Cyclical Nature of the Industry: The homebuilding industry is highly cyclical, meaning it is heavily influenced by economic cycles. During economic downturns, demand for new homes can drop significantly, leading to lower earnings and higher risk. Investors typically demand a lower P/E ratio for cyclical industries to compensate for this higher risk and earnings volatility.
Interest Rate Sensitivity: Homebuilders are particularly sensitive to changes in interest rates. Higher interest rates can increase mortgage costs, reducing home affordability and demand. This sensitivity to interest rates adds another layer of risk, leading investors to value these companies more conservatively.
Capital-Intensive Business: Homebuilding is a capital-intensive industry that requires significant upfront investment in land, materials, and labor. This high capital requirement can lead to lower returns on equity compared to other sectors, which can suppress P/E ratios.
Profit Margins and Growth Rates: Although homebuilders have shown strong earnings growth, their profit margins can be lower compared to high-growth sectors like technology. Additionally, the growth rates in homebuilding can be less consistent, which makes investors wary and results in lower P/E ratios.
Market Perception and Historical Performance: Historically, homebuilders have traded at lower multiples due to the perception of higher risk and lower growth potential compared to other industries. This historical undervaluation persists even when the sector performs well, as seen in the post-pandemic housing boom.
Dividend Policies: Homebuilders often reinvest earnings into land acquisitions and development rather than paying high dividends. This reinvestment strategy can lead to lower attractiveness for income-focused investors, contributing to lower P/E ratios”
I just want to acknowledge that “interest rate” is a vague term. The 30-year mortgage rate is a function at the long end of the yield curve. I think most would say that the 30-year mortgage rate is a function of a spread over the 10-year Treasury yield.